The First Detection of an Exoplanet with Polarimetry?

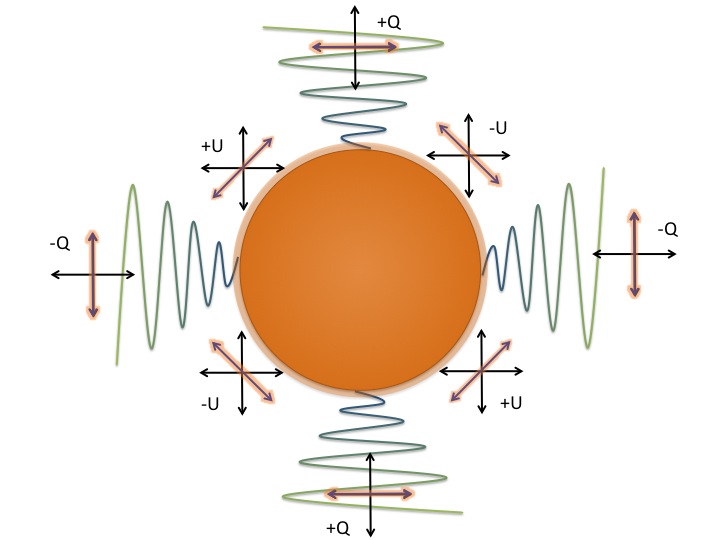
Polarimetry seems like a good method for finding exoplanets. The light from quiescent stars is unpolarized (the net signal, we should say, is unpolarized: it cancels itself out) so if we look for polarized photons only, we can reasonably assume the signal is from the scattering and reflection from a planet’s surface or atmosphere.

This suggests that hot Jupiter exoplanets — large gaseous planets orbiting close to their star — would be outstanding targets because being so near their light source and with such a large scattering surface, a large fraction of the star’s available light would be scattered, and therefore polarized, by them. In fact this was a hot topic around the turn of the millennium when the first optimistic predictions for the polarized light signals from these planets were made (e.g. Seager, Whitney & Sasselov 2000). Those predictions suggested signals as high as about 100 parts-per-million but typically in the 10s of ppm.

As we learned more about hot Jupiters, however, we learned that they are often dark, so while a lot of light might reach them, little of it would be polarized and scattered on to our telescopes. Furthermore the activity of some host stars may add problematic noise.

Campaigns to detect polarization from hot Jupiter systems seemed to succumb to these hinderances. Observations from three groups (POLISH, HIPPI and PlanetPol) produced only non-detections providing upper limits to the albedo and some insight into the nature of the planets, but no direct detections. One planet, HD 189733b (Permadeath) did have a claimed detection in the late 00s, but it was subsequently contradicted by follow up by two independent groups. They did not see the strong polarization signal and suggested that Saharan dust, a known source of atmospheric polarization, might have created a false signal in the earlier work. You can read more about this saga here.

This year the HIPPI polarimetry team have published their exoplanet system observations taken during a campaign over several years for four systems. We published inconclusive non-detections for two of the four systems in the hopes that the datasets may be useful to others.

For one system, however, we seem to detect stellar activity.
And for another, possibly… finally… the planet itself.

For HD 189733b (Permadeath) the expected polarization is only on the order of about 20 ppm, yet the polarization varies much more than this and the star is known to be active. Five observing runs spanning five years did not improve the errors. The variations also are not in sync with the orbit of the planet. Finally, the polarization from this system is akin to the broadband polarization (from Zeeman splitting) seen in other stars from previous stellar characterization campaigns (see Cotton et al 2019). This, along with the Saharan dust, could help explain the previous wildly changing levels of polarization seen from the system.

The data taken over several years overlaid for the four systems considered in the paper.  On the left is the data with the data reduction technique used in our previous HIPPI team papers and on the right with an improved approach.  See the paper for…

The data taken over several years overlaid for the four systems considered in the paper. On the left is the data with the data reduction technique used in our previous HIPPI team papers and on the right with an improved approach. See the paper for details.

The possible detection of polarization from a planet itself, is from 51 Peg b… coincidently the first exoplanet discovered around a sun-like star with any method in 1995. In this case the signal is fit to “Rayleigh Lambert” models, which simplify light scattering for planets where we expect Rayleigh scattering is the primary source of polarization.

Our best fit for 51 Peg b is for a polarization signal at 11.2 ± 4.0 ppm. This is in good agreement with predictions from more complex models where either the radius of the planet is on the smaller side (it’s not currently pinned down because it doesn’t transit) and the planet is a proficient Rayleigh scatterer, or a case with a larger radius where additional opacity sources are present as we’ve seen previously for WASP-18b.

Still, this is only a 2.8 sigma detection with a 1.9% false alarm probability (based on a bootstrap analysis) so this is not a claimed detection. (A signal is usually only considered a detection over 3 sigma for direct methods). By eye (below) you can see that while the data is more convincing than, say, HD 179949’s, it still has room for improvement. We hope that with polarimeters being designed by the HIPPI team and others, this possible detection can soon be either proven or disproven.

In the meantime, we’ve done our best with this paper to provide a thorough analysis, considering things like the interstellar medium and host star contributions, which are often overlooked.

The data (black) for four hot Jupiter systems observed with HIPPI/-2 presented in this paper compared to their best fit Rayleigh-Lambert phase curves.  HD 179949 and Tau Boo in the top panels do not have any reported trends.  However, HD 189733 (bot…

The data (black) for four hot Jupiter systems observed with HIPPI/-2 presented in this paper compared to their best fit Rayleigh-Lambert phase curves. HD 179949 and Tau Boo in the top panels do not have any reported trends. However, HD 189733 (bottom left) seems to show polarization due to stellar activity, and 51 Peg (bottom right) possibly shows polarization from the planet itself.

For more details on this I turn you to our paper accepted to MNRAS. (And if you’re really into this sort of thing, you should know that banding on a brown dwarf was detected with polarimetry last year as well!)

Soft Around the Edges

Exoplanet polarimetry astronomers will tell you one of the strengths of polarimetry is that it naturally nulls the starlight, so you know the signal you're getting is not from the star.  However, they will also tell you this isn't true in every case.  Stars themselves can produce polarised light signals from the Rayleigh scattering in their limbs (i.e. looking through the upper atmosphere at the edges of the star).  This can produce a signal when their limbs are asymmetric either from being obscured by planets or star spots, or from rotational or tidal distortion which can distort the atmosphere through gravity darkening, essentially changing the distribution of the darkened regions.

Our star, the Sun with star spots and Venus passing through its darkened limb.  

Our star, the Sun with star spots and Venus passing through its darkened limb.  


Learning more about these exceptions to the rule is vital to the future of reliable exoplanet polarimetry and is inherently a fascinating way to learn about stars.

The reason most stars don't produce much polarised light from their own atmospheres has to do with the way we measure linearly polarised light (light whose electric field oscillates along a particular plane). The orientation of polarized light is denoted by “Stokes parameters”, Q and I are for linearly polarised light and are offset from each other by 45 degrees.  They can be either negative or positive with the signs offset by 90 degrees.


Stokes parameters.  Stokes Q and U are used to measure polarised light.  Because they are vector, not just scalar quantities they encode information about the orientation of the objects polarising the light.

Stokes parameters.  Stokes Q and U are used to measure polarised light.  Because they are vector, not just scalar quantities they encode information about the orientation of the objects polarising the light.

On a symmetric star with an unobscured limb, no star spots, no planets moving through the limb, and no gravitational distortion those Stokes parameters cancel each other out.  Equal values of positive Q to negative Q equal zero, and so on.

On a symmetric star with an unobscured limb, no star spots, no planets moving through the limb, and no gravitational distortion those Stokes parameters cancel each other out.  Equal values of positive Q to negative Q equal zero, and so on.


You can imagine then, if the polarised light from a stellar limb is tangential to the surface that, taking the tangent as you move around a circle, the positive values in Q would be perfectly negated by the negative values a quarter of the way around from there.  If it’s a perfect circle this works out perfectly giving you a net value of zero polarised light.  In a case where there is substantial gravity darkening, as on a rapidly rotating star, those additional darkened regions produce a strengthened signal in polarised light.  And since the darkening is spatially dependent---along the equator where a fast rotator will bulge out---it creates a polarised light signal.

Now we consider Regulus.  Regulus is a multi-star system but the primary star, which we were observing, is a large blue-white star that rotates on its axis every 15.9 hours.  That’s very fast, especially considering it’s a bigger, more extended star than our sun.  Our own sun takes about twenty-four-and-a-half days to rotate and is much smaller.  Regulus rotates so rapidly that it bulges in the middle as you might expect when picturing a centrifugal “force” acting on a body that would otherwise be ball-shaped.  Planets like Jupiter also bulge in this way from spinning too fast.

McAllister et al 2005 took interferometric measurements of Regulus enabling them to infer the distortion, map the gravity darkening, and find the orientation of the star.

Long before that, Harrington & Collins 1968 predicted that distorted stars like these would produce a polarised light signal by the means I've just described.

That effect is what our team detected with the wee little HiPPI polarimeter attached to the Anglo-Australian Telescope.  Look for our paper (Cotton et al) in Nature Astronomy.
 

Updates: Learn more from this popular science article or the actual paper here!

Observations: Positive values of U with negative values of Q give way to negative values of U and positive values of Q as we move towards shorter (bluer) wavelengths.  The gray points are averaged over observations.  The red points are cor…

Observations: Positive values of U with negative values of Q give way to negative values of U and positive values of Q as we move towards shorter (bluer) wavelengths.  The gray points are averaged over observations.  The red points are corrected for interstellar polarisation.  The blue line is the fitted orientation axis from this adjusted data.  The green dashed lines show the bounds of the orientation axis from previous interferometric measurements.

Models (VSTAR): The top panel here shows a model of the gravitational darkening for Regulus.  The lower two panels show the polarisation vectors overlaid onto the surface.  Note the polarisation is stronger for the bluer (400nm) wavelength…

Models (VSTAR): The top panel here shows a model of the gravitational darkening for Regulus.  The lower two panels show the polarisation vectors overlaid onto the surface.  Note the polarisation is stronger for the bluer (400nm) wavelengths because this is driven by Rayleigh scattering.  In redder (700 nm) light we see a strong signal in negative Stokes Q.  

The Blue Skies of Permadeath

There's been a controversy in exoplanet polarimetry.  I know that sounds like something CSI Miami worthy, but I'm going to try to summarise it here in less sexy terms.

The first detection of polarised light from an exoplanet system was done with aperture (not imaging) polarimetry by Berdyugina et al. in 2008.  It was for what is now a very well-studied exoplanet with blue skies, glass rain, temperatures over 1100 degrees K, and winds whipping around at 8,700 km/h: HD 189733b (aka Permadeath).

The level of polarisation Berdyugina and her group found was way higher than we would expect from the planet.  This is estimated from models that take into account things like multiple scattering, which reduces the overall polarisation of the light as it bounces off many molecules and gets polarised in random directions, and the source, in this planet's case Rayleigh scattering is believed to be the primary source of polarisation.
 

Net starlight is usually unpolarised, and a planet can polarise the light as it scatters off an ocean or through the atmosphere via Rayleigh scattering or rainbow effects.

Net starlight is usually unpolarised, and a planet can polarise the light as it scatters off an ocean or through the atmosphere via Rayleigh scattering or rainbow effects.


When you look for the polarised light from a planet and you observe over that planet's period, you expect there to be particular fluctuations in the polarised light.  If Rayleigh scattering, like that observed in our own atmosphere, is really the cause, you expect two peaks (or troughs) in the polarised light signal depending on things like the inclination and eccentricity (actually if an orbit is face on you wouldn't see the variation over time because the angle never changes between us, the planet, and the star).


Examples of the polarised light signal from exoplanets with various orbital parameters (right) compared to the variation in albedo (left) from Seager et al. 2000. Rayleigh scattering maxes out when the star-planet-Earth are at 90 degrees, the polari…

Examples of the polarised light signal from exoplanets with various orbital parameters (right) compared to the variation in albedo (left) from Seager et al. 2000. Rayleigh scattering maxes out when the star-planet-Earth are at 90 degrees, the polarised light curve (shown) has the shape of the sum of the Rayleigh curve and the albedo; the extrema of a transiting planet thus are at +/- 70 degrees from the secondary eclipse (here 0 is SE).


And this is what Berdyugina et al. observed.  But it was a very high signal.

When Wiktorowicz followed the observations up in 2009 with the POLISH polarimeter, the signal wasn't there.  The polarised light did not vary over time as dramatically as Berdygina et al. observed, and certainly not with the period of the planet producing those two peaks we expect from Rayleigh scattering.

Not long after this though, in 2011, it seemed Berdyugina et al. solved the discrepancy.  If one looks for polarised light in blue light, you see a huge signal, but if you look in red light, as Wiktorowicz had, you see nothing.  This would make sense if Rayleigh scattering is the process polarising the light, since it scatters shorter wavelengths much more efficiently than longer wavelengths.  As most of us know, that is why our sky on Earth looks blue.  However the level of polarisation in blue light, while lower than their initial finding was still strangely high, so high that it would require the giant inflated planet atmosphere to not have multiple scattering.


Berdyugina et al. 2011 saw more variation in polarised light through the orbit of the planet in blue light, corresponding to a much higher albedo in blue. This was confirmed by Evans et al. 2013 but for values corresponding to much lower polarisatio…

Berdyugina et al. 2011 saw more variation in polarised light through the orbit of the planet in blue light, corresponding to a much higher albedo in blue. This was confirmed by Evans et al. 2013 but for values corresponding to much lower polarisation.


Photometrically, we do know that HD 189733b has a deep blue colour.  Evans et al 2013 found this using Hubble data of the planet's reflected visible light in different bands.  It reflects or scatters blue much more efficiently than red.  This paper also gave us albedos for the planet in blue light though, and using Buenzli et al 2009's model grid for polarised signals from realistic planet atmospheres we can see that in the best case HD 189733b would only have a polarised light signal of about 38 ppm (parts per million). Estimates using Lucas et al. 2009 suggest it would be no more than about 30 ppm in an idealised case.

New aperture polarimeters like HIPPI in Australia and POLISH2 in the United States are built to be extremely sensitive to polarised blue light, accurately detecting polarisations down to a few ppm.  They are the most sensitive polarimeters in the world.  And in 2015, separate observations done by different teams on each polarimeter found that even in blue light they could not reproduce the Berdyugina et al. 2011 findings.
 

The (binned) variation we observed, with a least squares fit Rayleigh scattering curve in red, compared the the curve fit to Berdyugina et al.'s data in blue. The offset from zero would be predominantly due to the interstellar polarisation from the …

The (binned) variation we observed, with a least squares fit Rayleigh scattering curve in red, compared the the curve fit to Berdyugina et al.'s data in blue. The offset from zero would be predominantly due to the interstellar polarisation from the ISM. Q/I and U/I are the normalised Stokes parameters, so their variation in relation to each other tells us about the planet's orbital orientation.


In our paper on the planet, we find variations of only about 30 ppm and offsets more akin to those seen by the POLISH2 team.  The data do not perfectly line up to that two-peak shape we expect, but fitting a Rayleigh curve by least squares 30 ppm is about the level of polarisation the data would suggest if the variation was due to the planet.  This is also around the same level of variation as that found by Wiktorowicz et al. in their 2015 paper. 

But this is only a 2-sigma detection: it is still possible that this is just noise or created by other polarising effects such as star spots.  Importantly, it fits the albedo in blue light detected by Evans et al. 2013 as well.  So while the terrifying, strange and hellish hot Jupiter, Permadeath, still has its ironic Rayleigh blue sky, it is probably not the super polariser it once seemed to be.  As for the unusually high measurements from the Berdyugina et al. observations, this could be due to Saharan dust events known to affect polarimetry from the Canary Islands (see our paper linked below or Bailey et al. 2008).

If you'd like to read more about our findings, and in particular the other effects that can cause polarised light signals for this and other systems, please do take a look at our paper, available on arXiv here, and out soon in MNRAS.

Another HIPPI paper: Southern Bright Stars

Did you know that although standard measurements for polarisation at the parts-per-million level in nearby bright stars have been completed for the northern hemisphere, no such study had been conducted for the south? 

**In my best Top Gear presenter voice** : Until now...

The HIPPI group's latest paper (accepted to MNRAS) has done just that.  50 nearby bright stars for the southern hemisphere have had their linear polarisation measured to a (median) sensitivity of about 4.4 parts-per-million.

We found that in the southern hemisphere the stars tend to have higher polarisations than in the north.  This is mostly because the Solar System sits above the mid-galactic plane (1, 2) and many of the stars we observed in the survey were also in or below the galactic plane (in the northern hemisphere PlanetPol survey, many of them were above the plane, and often closer to the Sun (3).  The interstellar medium polarises light over long distances, so an abundance of the medium can mean more polarisation (4).


HIPPI's southern hemisphere survey results are in green; PlanetPol's northern hemisphere survey results in red. The positions are in galactic coordinantes, the darkness of the spot shows the distance, the size of the bars show the amount of polarisa…

HIPPI's southern hemisphere survey results are in green; PlanetPol's northern hemisphere survey results in red. The positions are in galactic coordinantes, the darkness of the spot shows the distance, the size of the bars show the amount of polarisation.


Another reason was that many of our sources happen to be types of stars with intrinsic polarisation.  Usually stars do not have a net polarisation as the polarisation in their limbs cancels itself out (5).  If the star is prone to star-spots, surrounded by dust, or distorted in some way, it can produce polarisation from the star (or its surrounds) because either the limb is distorted/asymmetric or the surrounding material polarises the light.  In our survey, some of the stars were in close binaries or were late giants with surrounding hot gas or bright spots (6).

Why is this important?

It helps future studies of polarised light by helping other astronomers (and our own group) to gage the amount of polarised light we expect (particularly in calibrating new instruments).  It also tells us about the interstellar medium itself.  The polarisation in the ISM is due to trends in the alignment of the particles and that is related to the structure of and magnetic fields in our local galaxy.

If you can't wait for the MNRAS version, you can checkout the pre-print here: http://arxiv.org/abs/1509.07221


1: Bahcall 1985
2: Dehnen 1998
3: Bailey 2010
4: Hiltner 1949
5: Wiktorowicz 2014
6: Cotton 2015

Thesis Submitted

I submitted my thesis on Monday!


The very catchy title is "Polarimetry of hot-Jupiter systems and radiative transfer models of planetary atmospheres".  It covers a range of topics from deuterium on Uranus, to new polarimetric observations of exoplanet systems, to applying a very robust radiative transfer program called VSTAR to hot Jupiters.  All of the topics tie into exoplanet characterisation and planet formation.

For any students who may have landed here and are about to start writing up, I can offer three practical tips:
 

  1. Do stretchy things.  Maybe you don't have time to attend your yoga class but you can do a few moves or stretch near your desk.  It sounds like nothing but makes a world of difference for me.  I find it helps when observing too.
  2. I used this thesis template, and think it's the absolute tops.  Highly recommended.
  3. Consider changing your environment.  I was fortunate to have a desk to work at, but it wasn't always the best environment.  Libraries (on your campus, on other campuses, city libraries, etc.;  my favourite in Sydney is the State Library of New South Wales) and coffee houses (depending on the culture; in Sydney my favourite was Berkelouw Books) are both places that worked for me.

I'm happy to have some "free-time" back to finish the papers based on the thesis, work with collaborators, and get a couple of blogs posted on here.

The HiPPI Polarimeter

In an effort to keep these informative but approachable links to more information and definitions for general public are embedded throughout.


(Most of) the HIPPI team observing at the AAT in 2014.  Credit: J.Bailey

(Most of) the HIPPI team observing at the AAT in 2014.  Credit: J.Bailey


If you wanted to get information about an exoplanet you couldn't see directly, you might try either looking at how it affects its star's light or by making the planet more visible by making the star's light less overwhelming.  Most techniques used to characterise exoplanets so far have relied more on the first approach, but one area that is more akin to the second and perhaps hasn't gotten the attention it deserves, is polarimetry.


Polarimetry is a great tool for getting information on exoplanets because it

  • improves the contrast - stars light isn't very polarised but a planet can have lots of polarised light that has been scattered by gases, aerosols or a surface
  • gives you orbital information - polarised light is directional so it can be combined with other measurements to give a very detailed picture of the planetary system
  • provides information about the atmosphere including the presence of clouds; plus, by the effect of Rayleigh scattering or rainbows, it can tell you what sort of molecules form the condensates (clouds and aerosols) in the atmosphere


The angle at which a rainbow forms changes depending on the type of molecule forming a droplet because the index of refraction will change.  Credit: Wiki

The angle at which a rainbow forms changes depending on the type of molecule forming a droplet because the index of refraction will change.  Credit: Wiki


This March our group had our first paper on the HIPPI polarimeter accepted by MNRAS.  The paper outlines the design of the polarimeter itself.  It is the most sensitive astronomical polarimeter in the world (in use) currently.  Its predecessor, PlanetPol was more sensitive but better suited for red light and is no longer available for observations.


Small but effective-- testing HIPPI in the lab.  HIPPI uses carefully selected commercially available and 3-D printer components which helps drive the cost down while maintaining quality. Credit: J. Bailey

Small but effective-- testing HIPPI in the lab.  HIPPI uses carefully selected commercially available and 3-D printer components which helps drive the cost down while maintaining quality. Credit: J. Bailey


HIPPI (High Precision Polarimetric Instrument) is geared more for blue light sensitivity since we wanted to look for polarised light from exoplanets.  Many hot Jupiter exoplanets are expected to have a high blue albedo, primarily from Rayleigh scattering (Burrows 2008, Berdyugina 2011).  This polarimeter gets very high precision, detecting fractional polarisation (from a system) down to a few (3--4) parts per million.  Hot Jupiter exoplanets are theorised to only produce fractional polarisation at ten parts per million at best (Seager et al 2000), so this type of precision is vital.


Along with an outline of the instrument itself, preliminary data about how HIPPI is being used to help us map the interstellar medium is available at the first author's website.


We have also obtained data on a few exoplanet systems and have been awarded more time on the AAT to observe in May, so a paper on our findings for exoplanets should be out soon.


Prior to the photometric albedo measurements by Evans et al 2013, Berdyugina et al 2011 had polarimetric evidence that the exoplanet HD 189733b would appear blue in colour. Credit: Berdyugina et al 2011.

Prior to the photometric albedo measurements by Evans et al 2013Berdyugina et al 2011 had polarimetric evidence that the exoplanet HD 189733b would appear blue in colour. Credit: Berdyugina et al 2011.


Interested in past attempts to detect polarised light from exoplanets?  


1. First Detection http://arxiv.org/abs/0712.0193

2. Refutation http://arxiv.org/abs/0902.0624

3. Confirmation of surprisingly high signal http://arxiv.org/abs/1101.0059

4. Attempts at other systems http://arxiv.org/abs/0807.2568


The HIPPI Instrument Paper: http://arxiv.org/abs/1503.02236